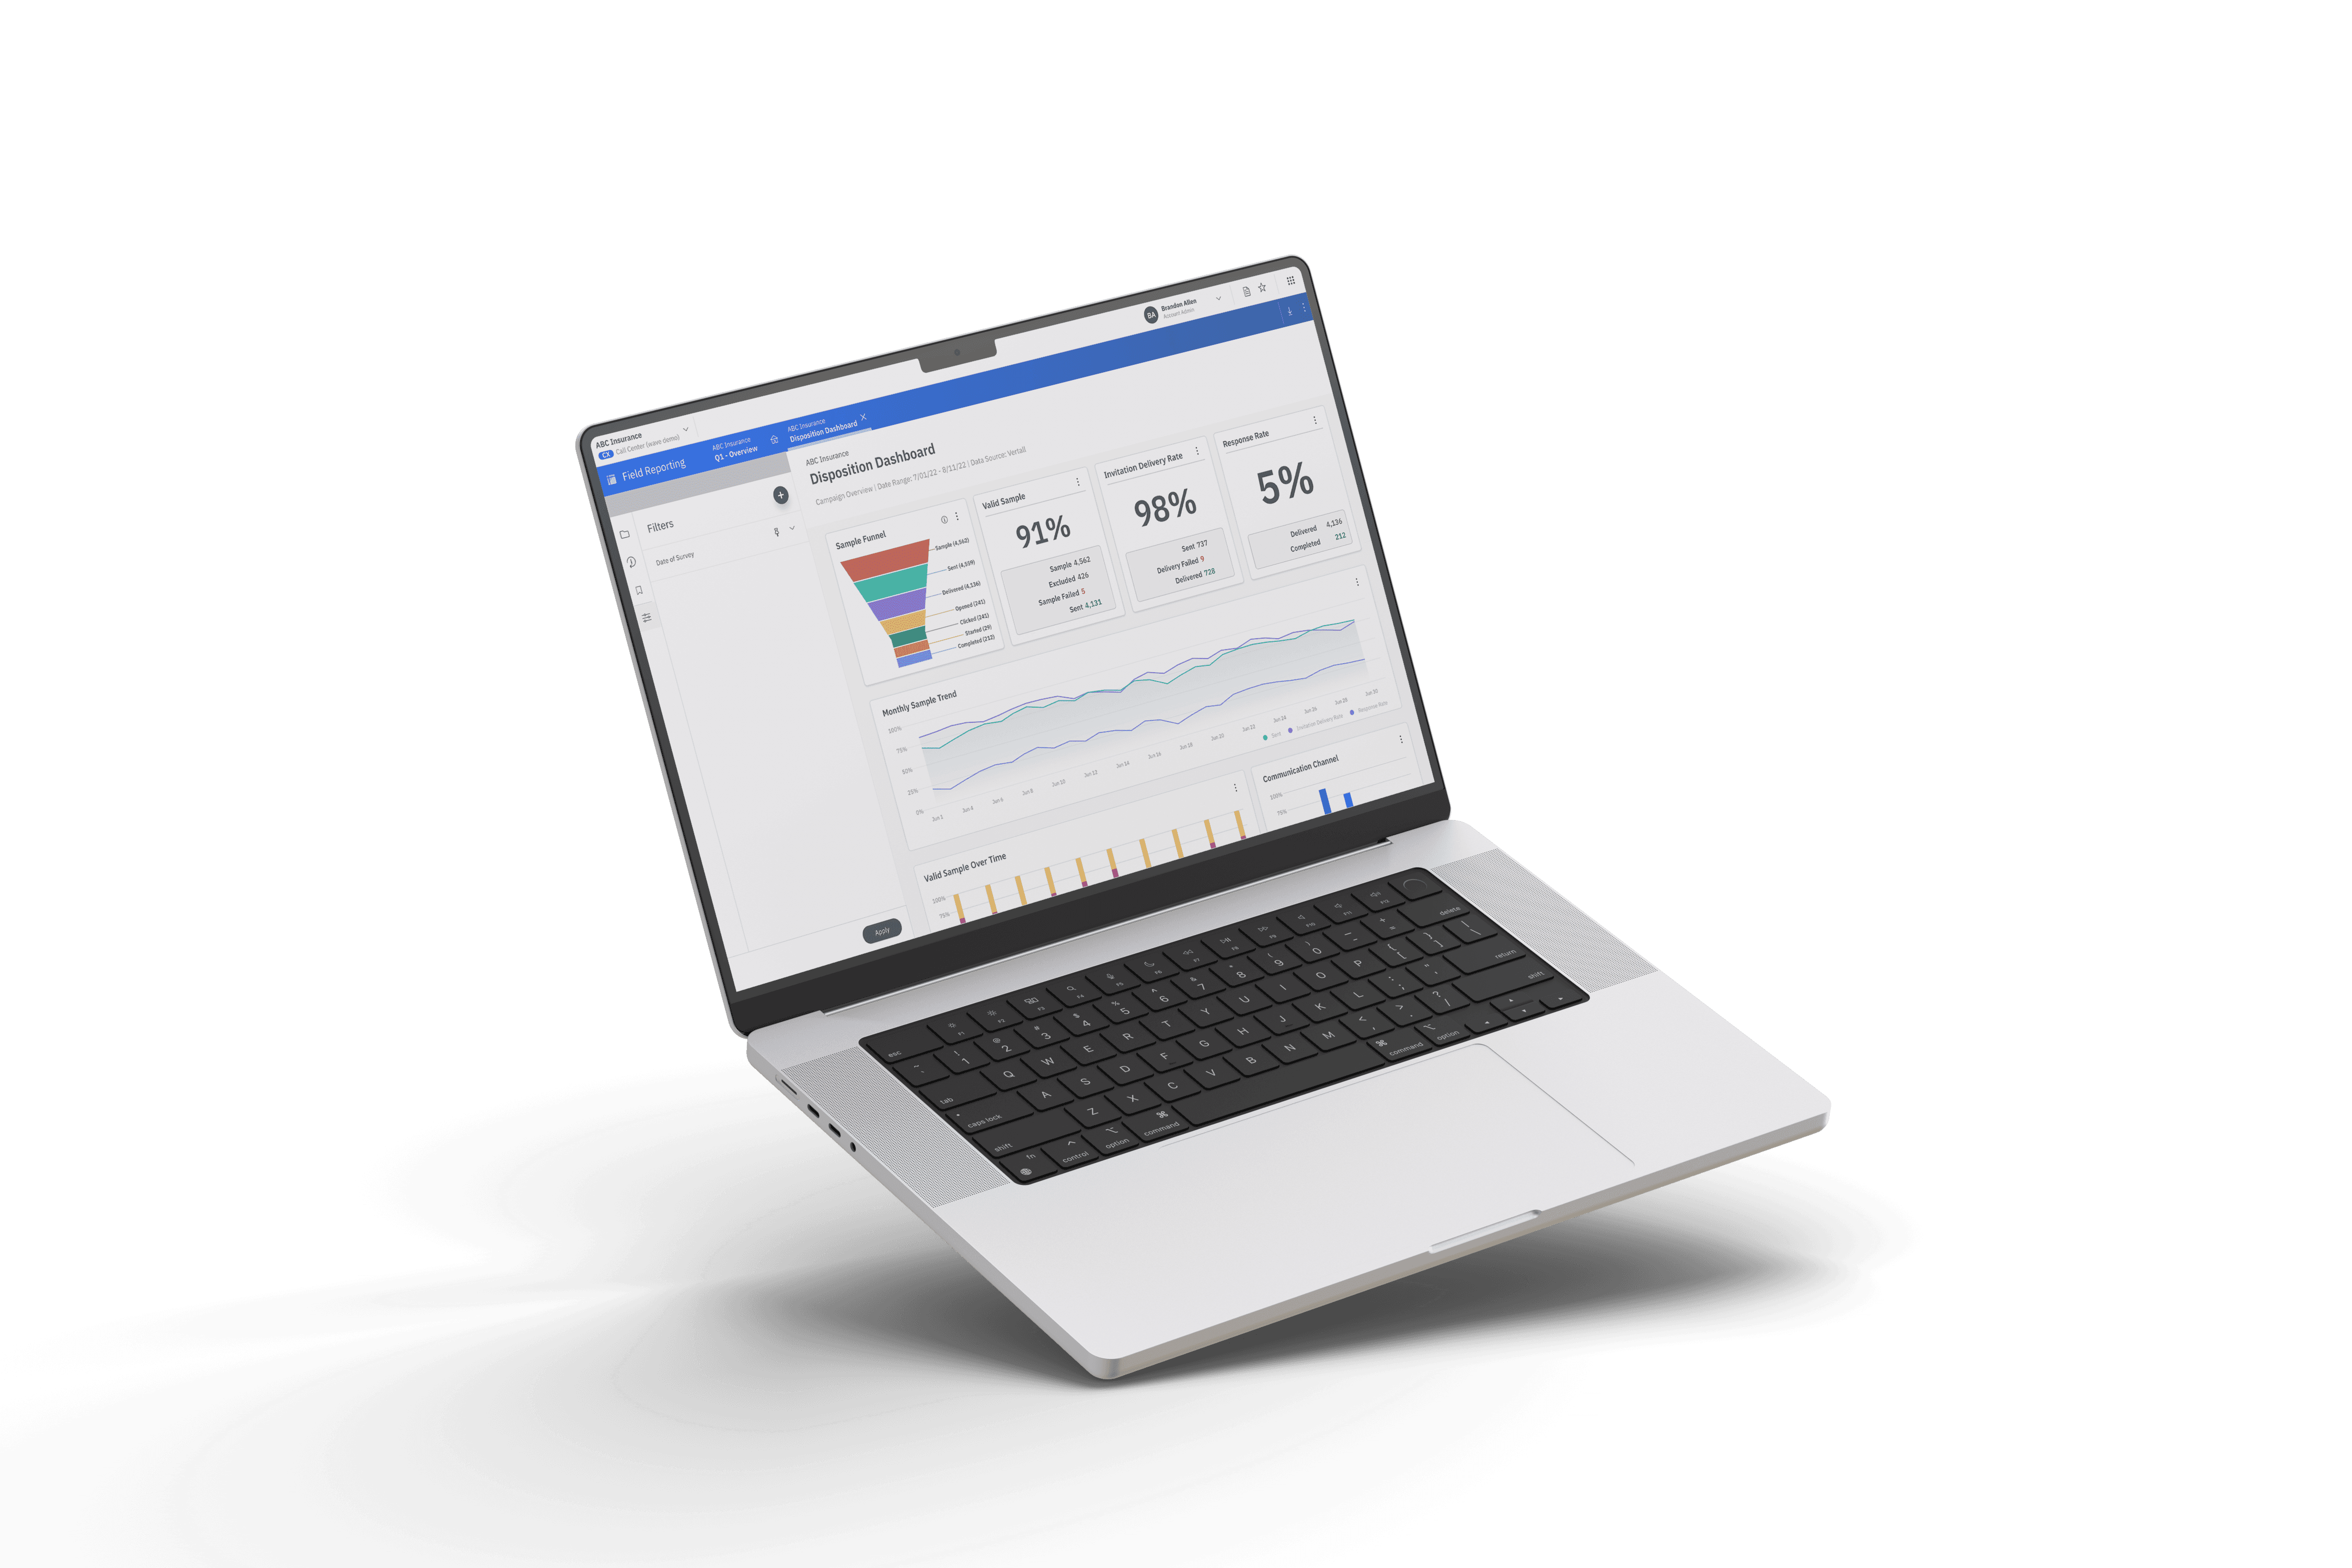
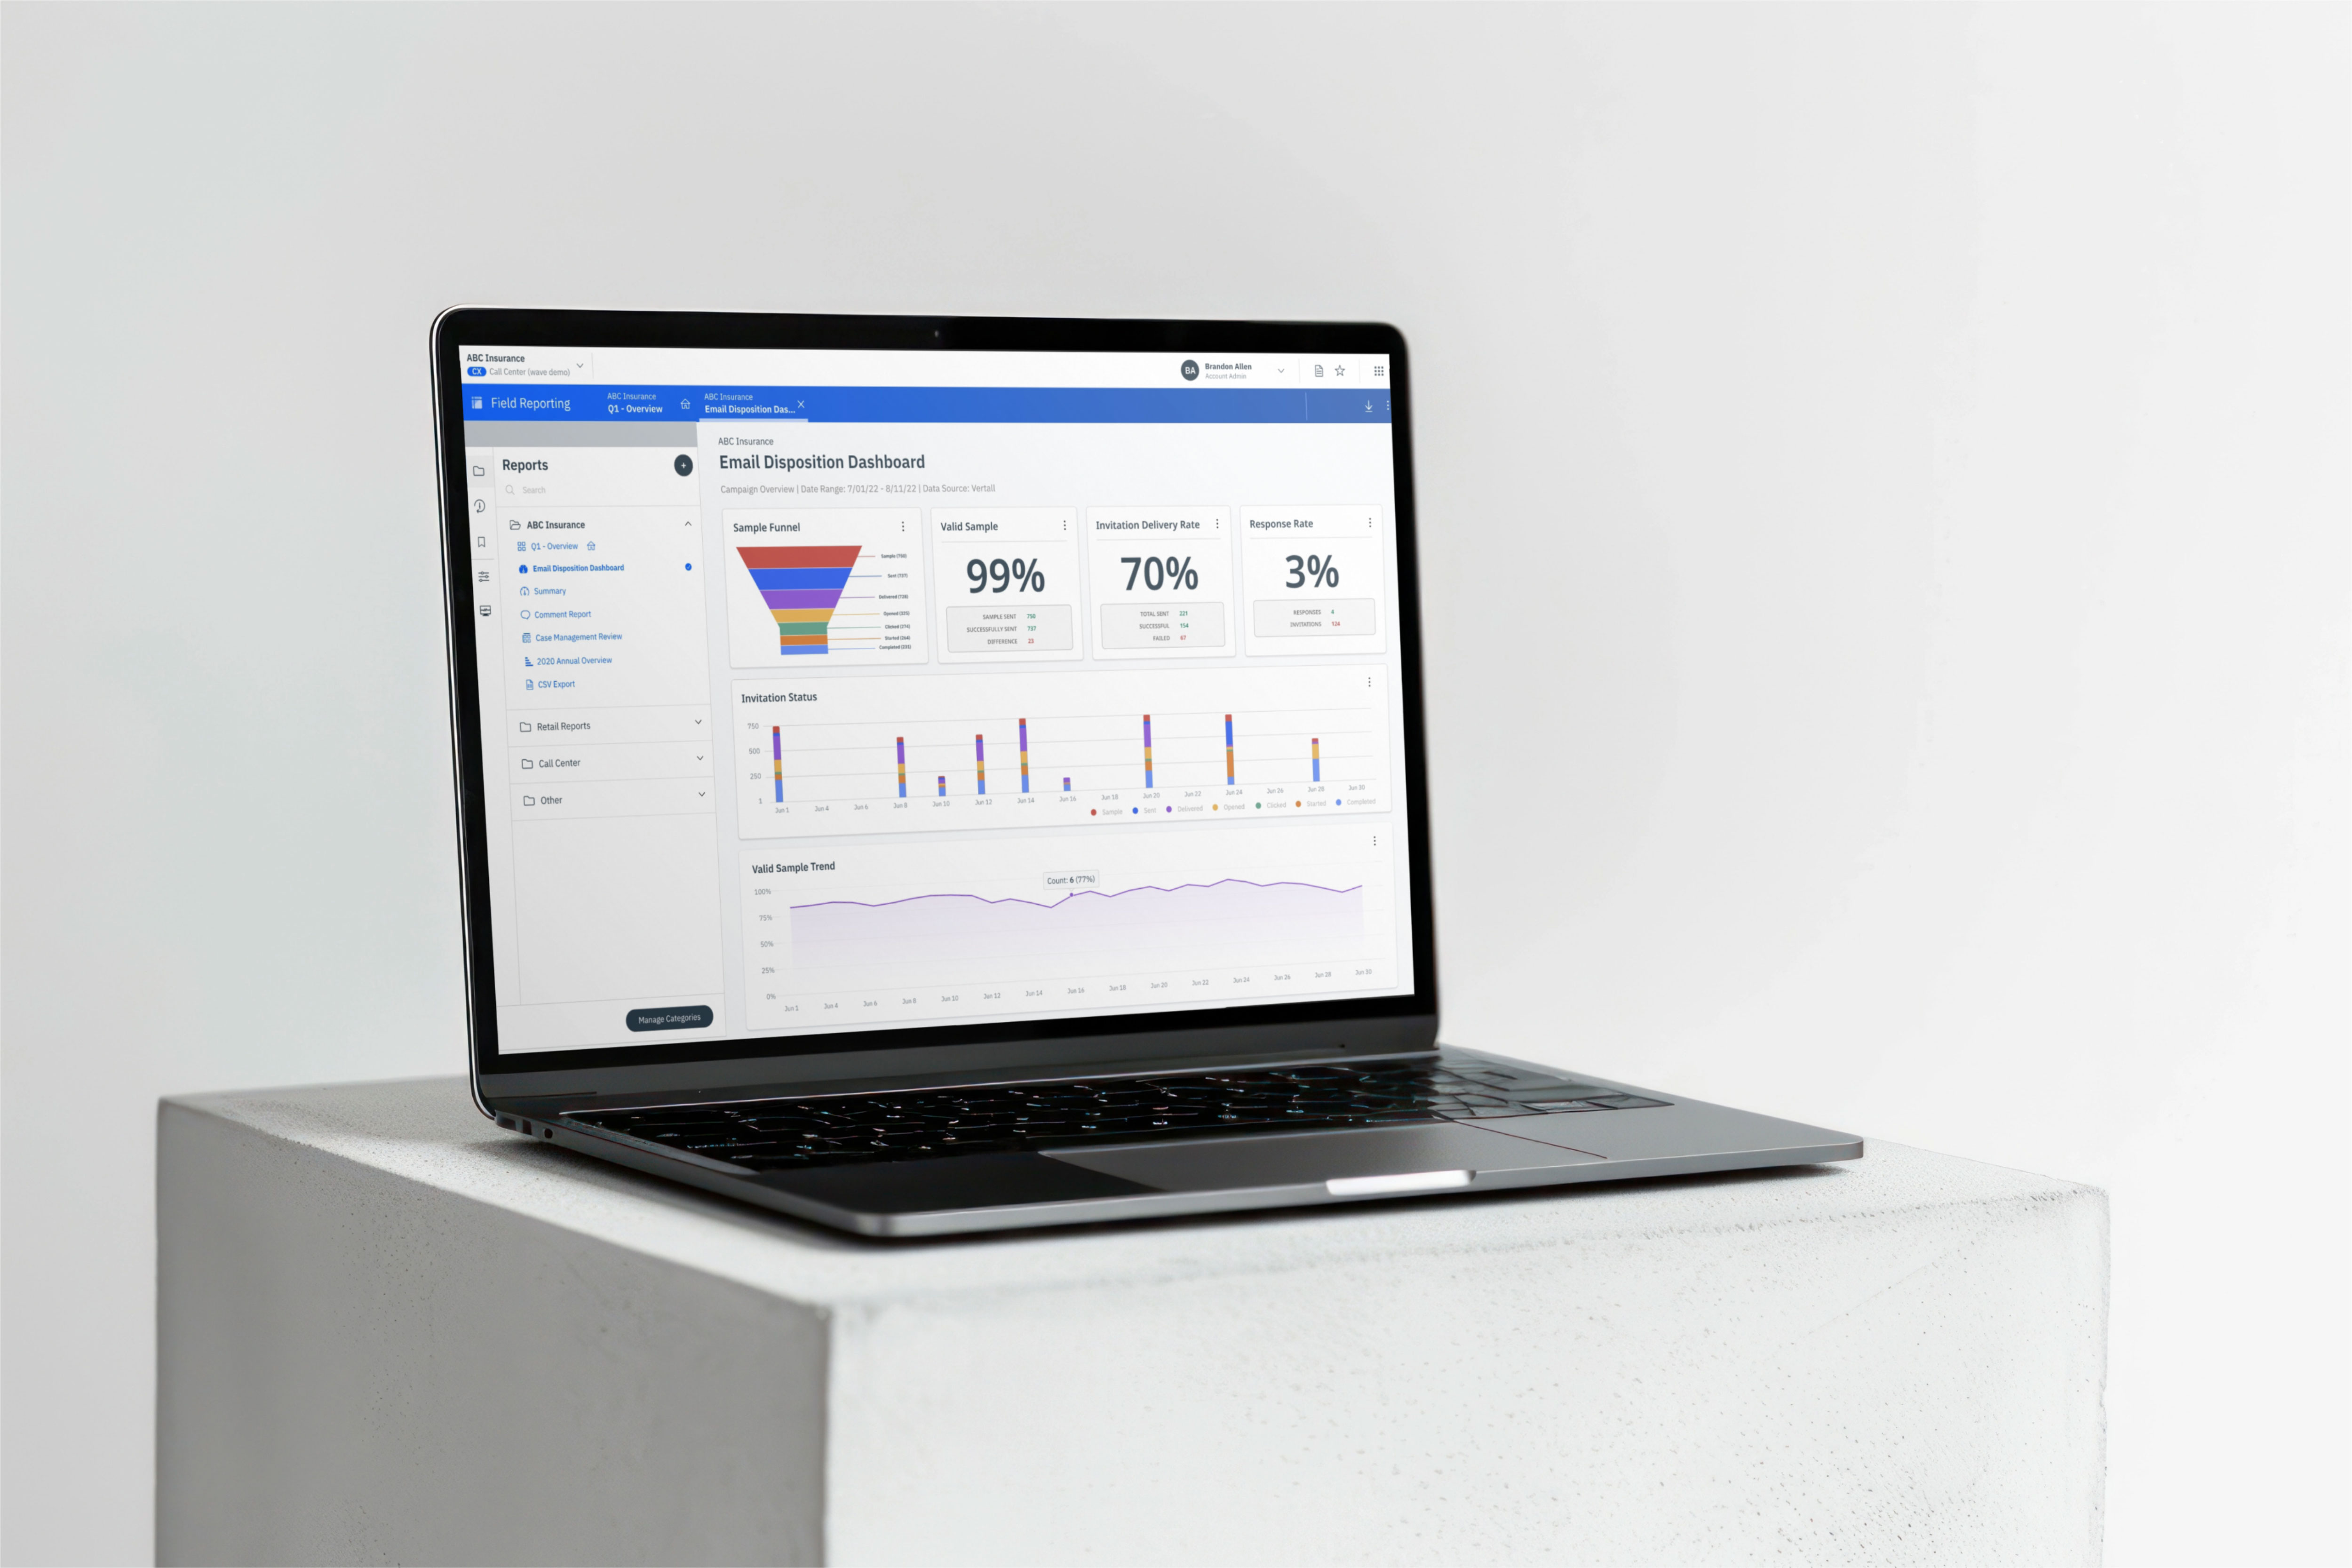
Disposition Dashboard
service
Product Strategy, User Experience, Interface Design
sector
SaaS
Year
2023
Prototypes:
Dashboard Builder
Dashboard Consumption Screen
Scope
Disposition Reporting was the merging of 2 different companies aquisitions: BrandXP and MaritzCX. There where clients in both companies that were accustomed to the experiences provided and during the launch of XI, InMoment tried to reconstruct these dashboards of data into a feature known as "Campaign Insights". This feature lived in the survey builder part of our platform. During 2023, our product team wanted to move this feature to be a part of the Field Reporting Platform - That's where I come in!
Challenges
Most clients enjoyed the software they had been using from BrandXP or MaritzCX. A transition was unappealing unless it used the same interface but with a refreshed look.
Our company was going through a major transition in August of 2022. Hundreds of long-term employees left the company to seek other opportunities. This left most new hires in the dark. We tried to understand all the code, reasons, and logic our predecessors left for us.
Previous staff did not leave documentation info from their software trials. Less experienced engineers and designers were leading new hires. They had worked at the company during the acquisition. Many of our organizational practices were not maintained over the course of 2022. This confused teams about how to solve problems.
Bugs appeared in steady succession, prompting teams to speed up their process. For Field Reporting alone, we kept a log of 200-300 bugs from October 2022 to March 2023. As the engineers worked on problems, the bugs stayed at a range of 160-190 consistently.
Solutions

A lot of the research phase of this initiative was able to improve communication pathways between our data analysts, development and designers. As a result of this project's continuous analysis, flexible OKRs and dynamic user personas, we were able to establish clear baseline objectives to help move the needle in turning ambiguity into actionable insights.
New Feature Discussion
The triad (design, product and development) came together to discuss:
Existing features of previous software
Implemententation of XI's Campaign Insights (XI survey app's inital version of disposition reporting)
Gaps identified by feedback customer service managers had received from clients.
Watching User Sessions
These were sectioned by industry so we could see if any visual patterns could be identified. We would watch user sessions through Fullstory and identify key user flows through the funnel feature. This helped us align with the data scientists and to track baseline metrics that supported our over-all analysis.
Feedback Validation & Synthesizing
Met with InMoment internal experts to hear concerns and validate what was talked about in the hand-off meeting.
I generated a spreadsheet with their contact information, date interviewed, a link to notes doc and to the recorded zoom session. This part of the project generated a ton of additional feedback not considered in the first discussion.
Using FullStory and help from our dev teams, we found insights in the platform's interaction data. After merging this with data from the internal interviews, we reviewed sessions from our top client's custom dashboards.
Results

Increased Traffic
Within the first month of the Disposition Dashboard launch, top client's like Nike, Nissan and GM were instantly utilizing this new feature and offering insights.
Improved User Engagement
Visitors and client adoption when up when we started to roll out these now updates. Feedback received included easier to navigation and gain insights from, happy to have customized dashboard content relating to specific metrics they were tracking, and streamlined workflow from long-time users!
Positive Client Feedback on Updates
In conclusion, this mix of UX research and tools removed the guesswork from problems field reporting was having. Ultimately leading to a 500% increase in website traffic, instant adoption from our most engaged clients and easier to understand results communicated through our improved dashboard design. We were also able to improve communication pathways between our data analysts, development and designers as a result of this project's continuous analysis.
By focusing on user experience, OKRs, and systematic approach to learning the needs of the different user personas, InMoment's product teams were able to establish clear, measurable key results to guide future iterations of reporting metrics.


